Networks
Clicking on the Networks tab in the navbar leads to a page that displays all available networks (graphs). This can be visualized in the image below.

This page includes networks that were generated using the WebOCD service, as well as all the networks that were imported to WebOCD Service. You can also see some basic data such as name, number of nodes and edges about each network. Additionally, you can view the presence of the following traits:
- D - directed edges
- W - weighted edges
- Z - Zero edge weights
- N - Negative edge weights
- L - Self loops
From this page, you also have an option to click on one of the buttons Co, Cn, CS to view covers, centralities, and cooperation simulations of a graph respectively. Or you can click on R to remove the graph (note: this will also remove all associated covers of the graph).
Specific Network
Sometimes you might want to see more information about a specific network, instead of getting a general overview of all available networks. You can achieve this by going to the page of a specific network. This page can be accessed by clicking on the network name, anywhere throughout the WebOCD. For example, from the Networks or Community Detection tabs.
This is visualized in in image below, where we are accessing network LFR-Graph-1. This page (shown below) is dedicated to the selected network and allows you to gather all the available information about the network or execute algorithms using the selected network.

By clicking on one of the buttons under the purple square in the image, you will be redirected to Covers, Simulations, or Centralities, and cooperation simulations pages that display the respective information using the selected network.
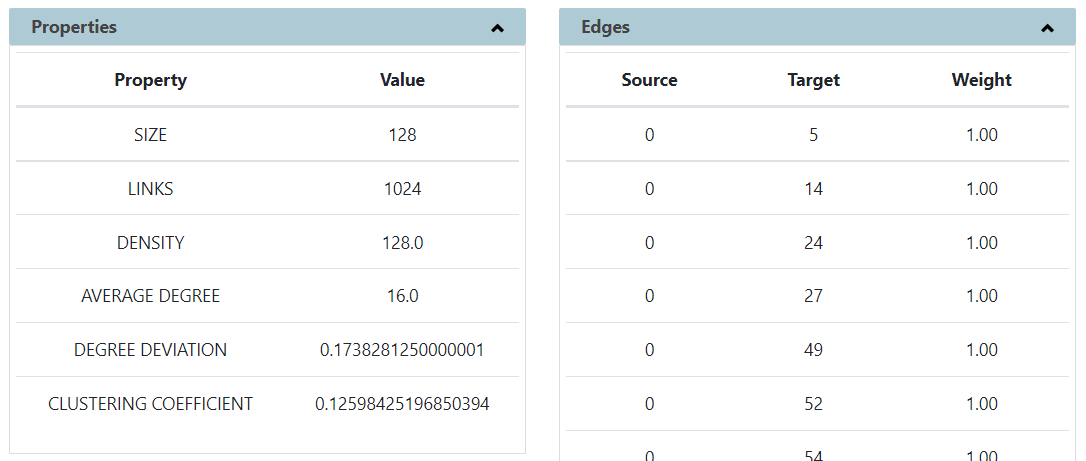
If you click on Properties or Edges tabs (red square on the picture), you can access detailed information about graph properties and its edge list (note: edges tab can get extremely lengthy, depending on the network size).
You can also run various WebOCD algorithms using the selected network, by clicking on one of the buttons shown under a blue square on the image.
One awesome feature of WebOCD is that you can visualize the networks and covers, not just conduct calculations based on them. For this, you can use the Visualization tab (pink square on the image). Demo of visualization is shown on the Visualization page.
Community Detection
Clicking on the Community Detection tab in the navbar leads to a page that displays all available covers. This is shown in the image below.

Just like with the networks page, covers displayed here include covers generated through WebOCD Service, as well as those that were imported. Similar to the networks page, you can see some data about the available covers. This includes the cover name and the graph based on which the cover was created. Also, you can see the cover creation method which corresponds to one of the Benchmark or OCD algorithms, and the number of communities that the cover has. By clicking on R you can remove the cover. Unlike graph removal, cover removal does not affect the underlying graph. Additionally, you can also download the cover in .xml or .txt formats.
All Covers of a Network
When you’re working with multiple networks and various algorithms, the number of covers can quickly become large. This can make it a bit of a hassle to keep track of all the covers on the Community Detection page. Using WebOCD you have the option to display a page with only the covers of some specific network. To reach this page, you can click on the Covers button, located on the page for specific networks. In the example shown below, we see two covers available for the network called LFR-Graph-1. These are LFR-Cover-1 and SLLP-Cover. Information displayed here is the same as on the Community Detection page, but here the information is only provided for the selected network (LFR-Graph-1).

Specific Cover
Similar to wanting to see more info about a specific network, sometimes you might want to look at a specific cover in more detail. This can be achieved on a cover page. This page can be reached by clicking on the name of the cover anywhere throughout the WebOCD (e.g. on the Community Detection page). Here, apart from seeing basic cover information and having a download option, you can run and view different metric algorithms or visualize the covers.
Below you can see the page of SLLP-Cover which was generated based on a network called LFR-Graph-1, using the Speaker Listener Label Propagation Algorithm. In the metrics tab, you can see what the execution time of the cover generation was. Also, you can see the extended modularity metric value. If you run more metrics using this cover, the results will appear here as well.

Feedback
Was this page helpful?
Glad to hear it! Please tell us how we can improve.
Sorry to hear that. Please tell us how we can improve.