Centrality
In WebOCD you have an option to calculate various centrality values on the available networks. To do so, you need to navigate to the page of a specific network. Here you need to click on the Run Centrality Calculation tab. As you can see in the image below, here you can select from a large variety of centrality measures.

After you finish the selection, clicking the  button calculates the centrality. To view the centralities, you need to click on the Centrality button on the navbar. This will redirect you to a page that lists all the available centrality calculation results. In the example below, we only have two such result.

By clicking on the desired centrality result, you go to the page of that specific centrality, where you can acquire more detailed information.
Display Centrality Values
In order to view centrality measurements for each node, you can click on the Centrality Values tab.

Here you have a choice to display values for all nodes, or values for top K nodes. It can be practical not to display all values when the network is large.
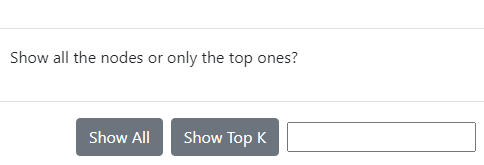
This process is shown in the gif below. Here we select to display Degree Centrality values of the top 10 nodes. We also tick the High Precision box to increase the decimal precision of displayed values. As you can see on the gif below, node 99 has the highest value for a given centrality.

Visualize Centrality Values
Instead of plain data, you might want to visualize centrality values. You can do so by clicking on the Visualization tab, which is similar to visualization for covers. This will display a network, the nodes of which will be affected by centrality values. By default, centrality values affect the node size. This can be seen in the gif below. As you see, node 99 that has the highest centrality value is also the largest node.

You can also display the centrality network in a different way. For example, instead of node sizes, node colors can be changed depending on the centrality values. This is visualized below.

Evaluation Mode
WebOCD gives you the option to compare and evaluate different centrality measures. To do so, go to the centrality page and click on the  button. This will open a page where the available centrality results are displayed. Here you need to select the centralities you want to evaluate (click on them) and then the desired type of evaluation (Average, Compare, Correlation, Precision).
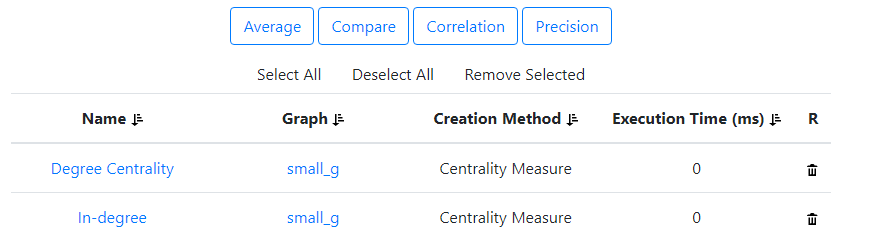
Below you can see a small demo of calculating the Pearson correlation matrix of Degree Centrality and In-Degree centrality values of a network.

Feedback
Was this page helpful?
Glad to hear it! Please tell us how we can improve.
Sorry to hear that. Please tell us how we can improve.