Visualization
In WebOCD, you have the possibility to visualize the networks, instead of just working with data. Visualization helps with network analysis and gives you a clearer picture of the network structure. To visualize some network, you need to navigate to the page of that specific network. Similarly, to visualize a cover you need to navigate to the page of that specific cover. From there you can click the  button.
There are three formats in which you can visualize the networks and covers. You can switch between them by clicking the desired format button.

below you can see how each of these formats looks. Using the network generated in the benchmark algorithm demo.
SVG
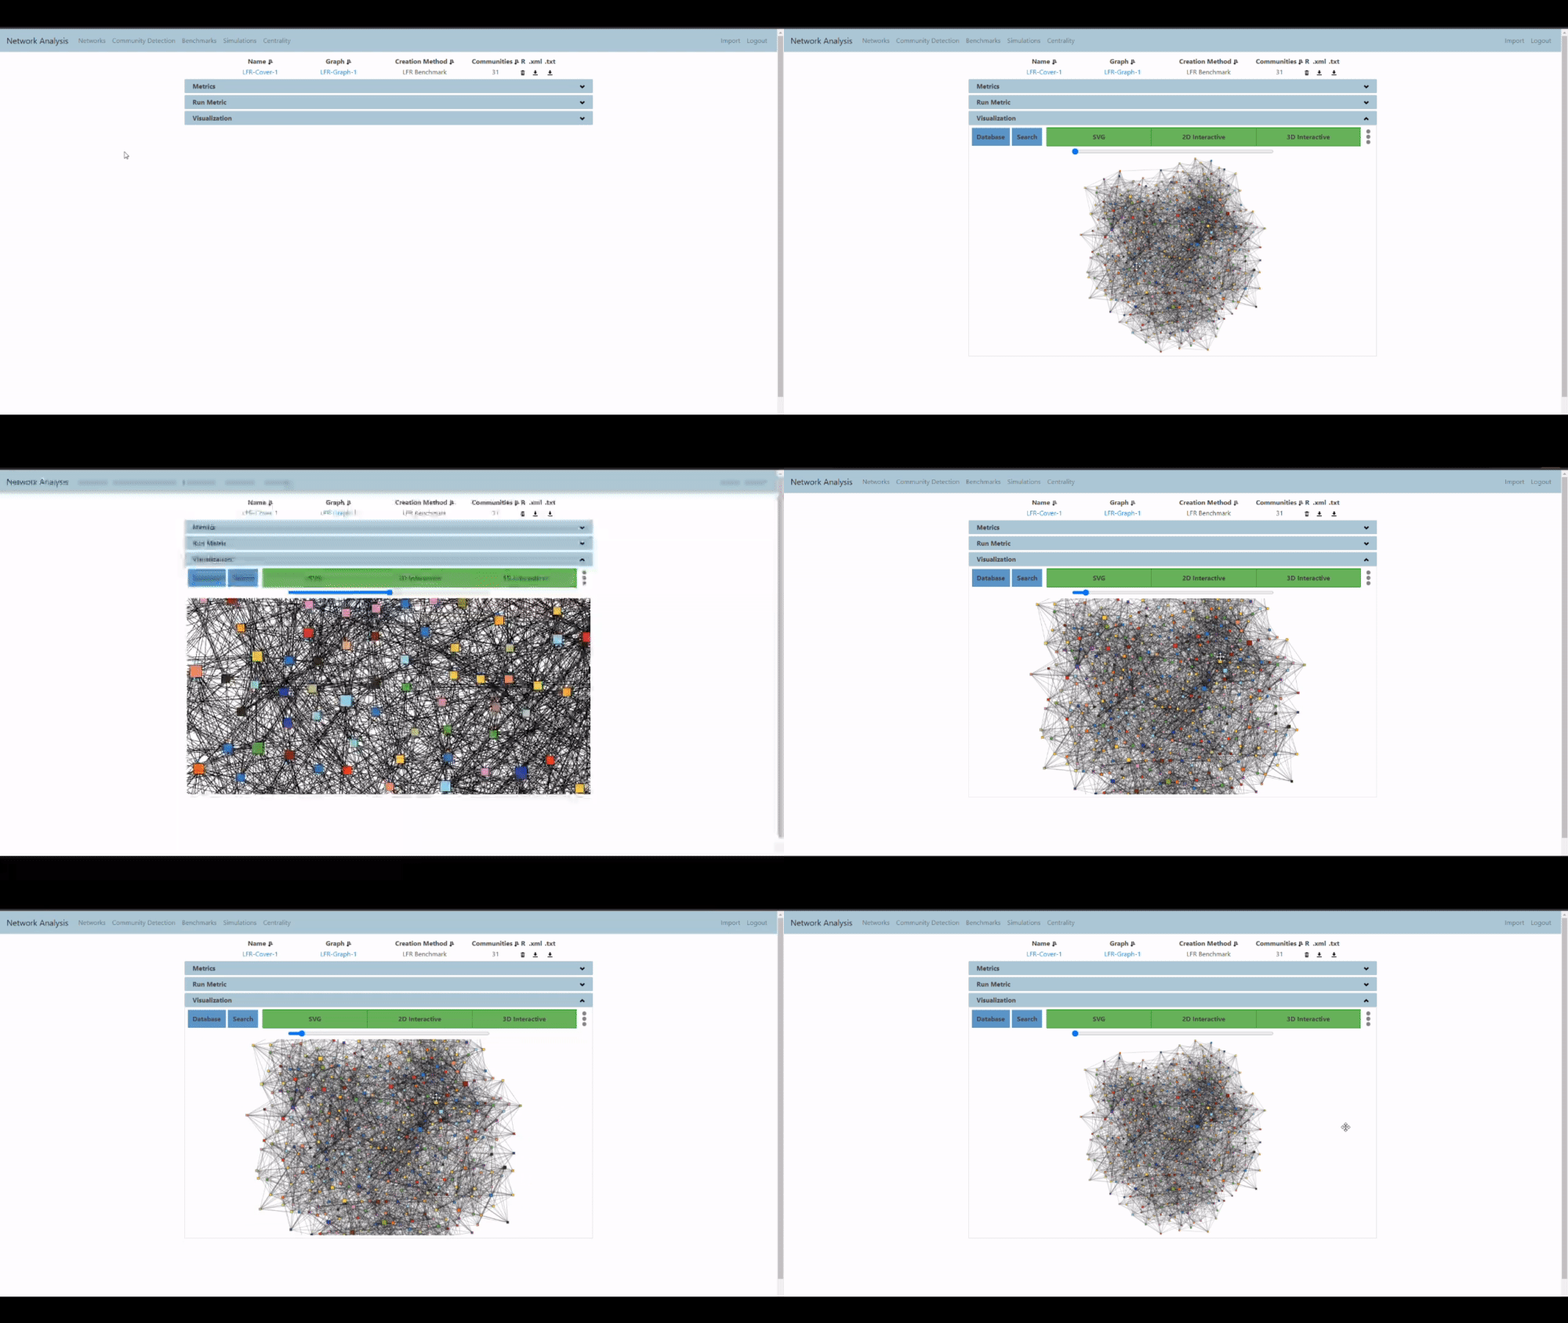
SVG format provides a static image of the underlying network or a cover. As you can see on the gif below, you can zoom in on any area to get a more detailed view of that area.

2D Interactive
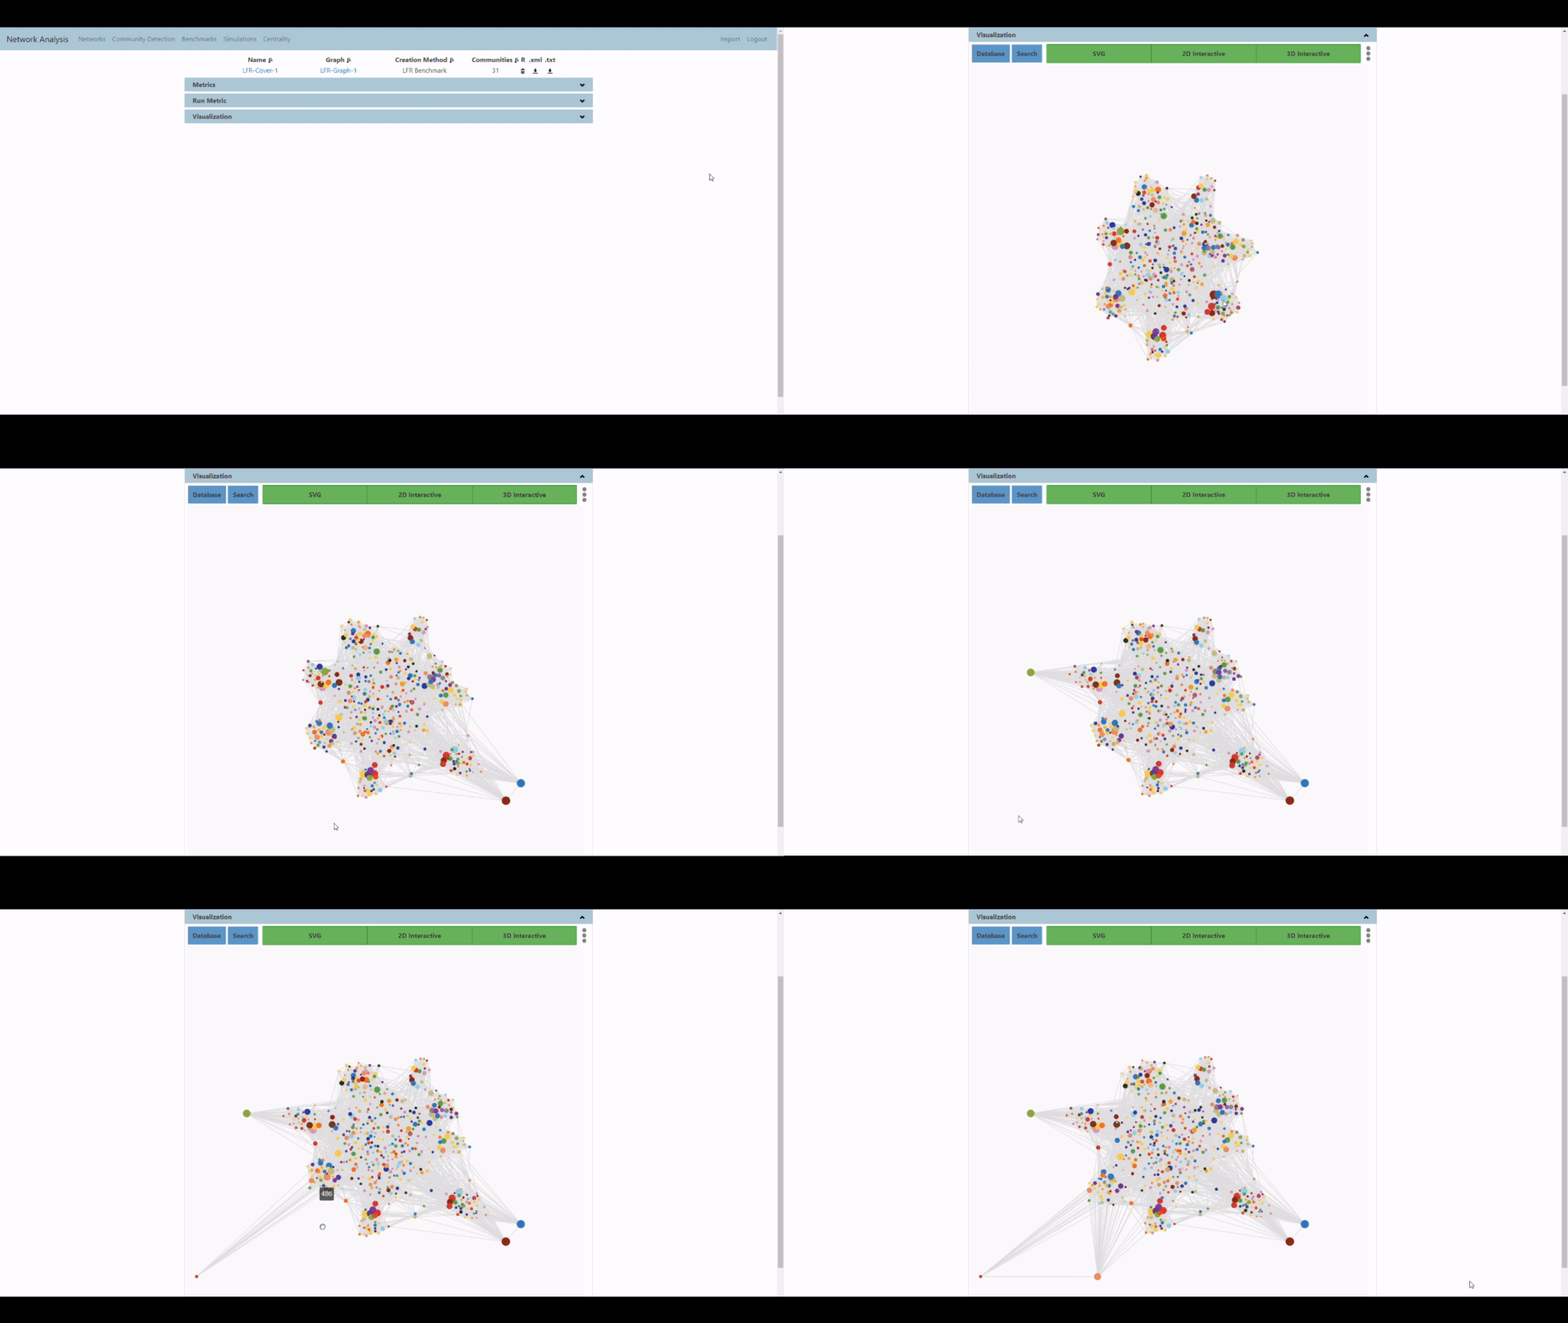
If you want to have more flexibility with how you view your network you can use the 2D interactive format. In this format, unlike only zooming in on specific areas, you can also modify how the network looks. For example, you can pull some nodes to any location and depending on the node size, the moved node will exert force on its neighboring nodes, which will result in the neighboring nodes moving as well. For example, in the gif below, we first pull the blue node (node 498) away, which is followed by its neighbors automatically being pulled.

3D Interactive
Sometimes when networks get really large, it can be difficult to keep track of what is going on. While 2D visualization provides a lot of flexibility, you can add a whole new dimension by selecting the 3D interactive format. This will display the 3D view of the network. Here you can move nodes as you please similar to the 2D format. In addition, you can turn the whole network as you please. This is shown in the gif below.

Feedback
Was this page helpful?
Glad to hear it! Please tell us how we can improve.
Sorry to hear that. Please tell us how we can improve.